PORT FACTS
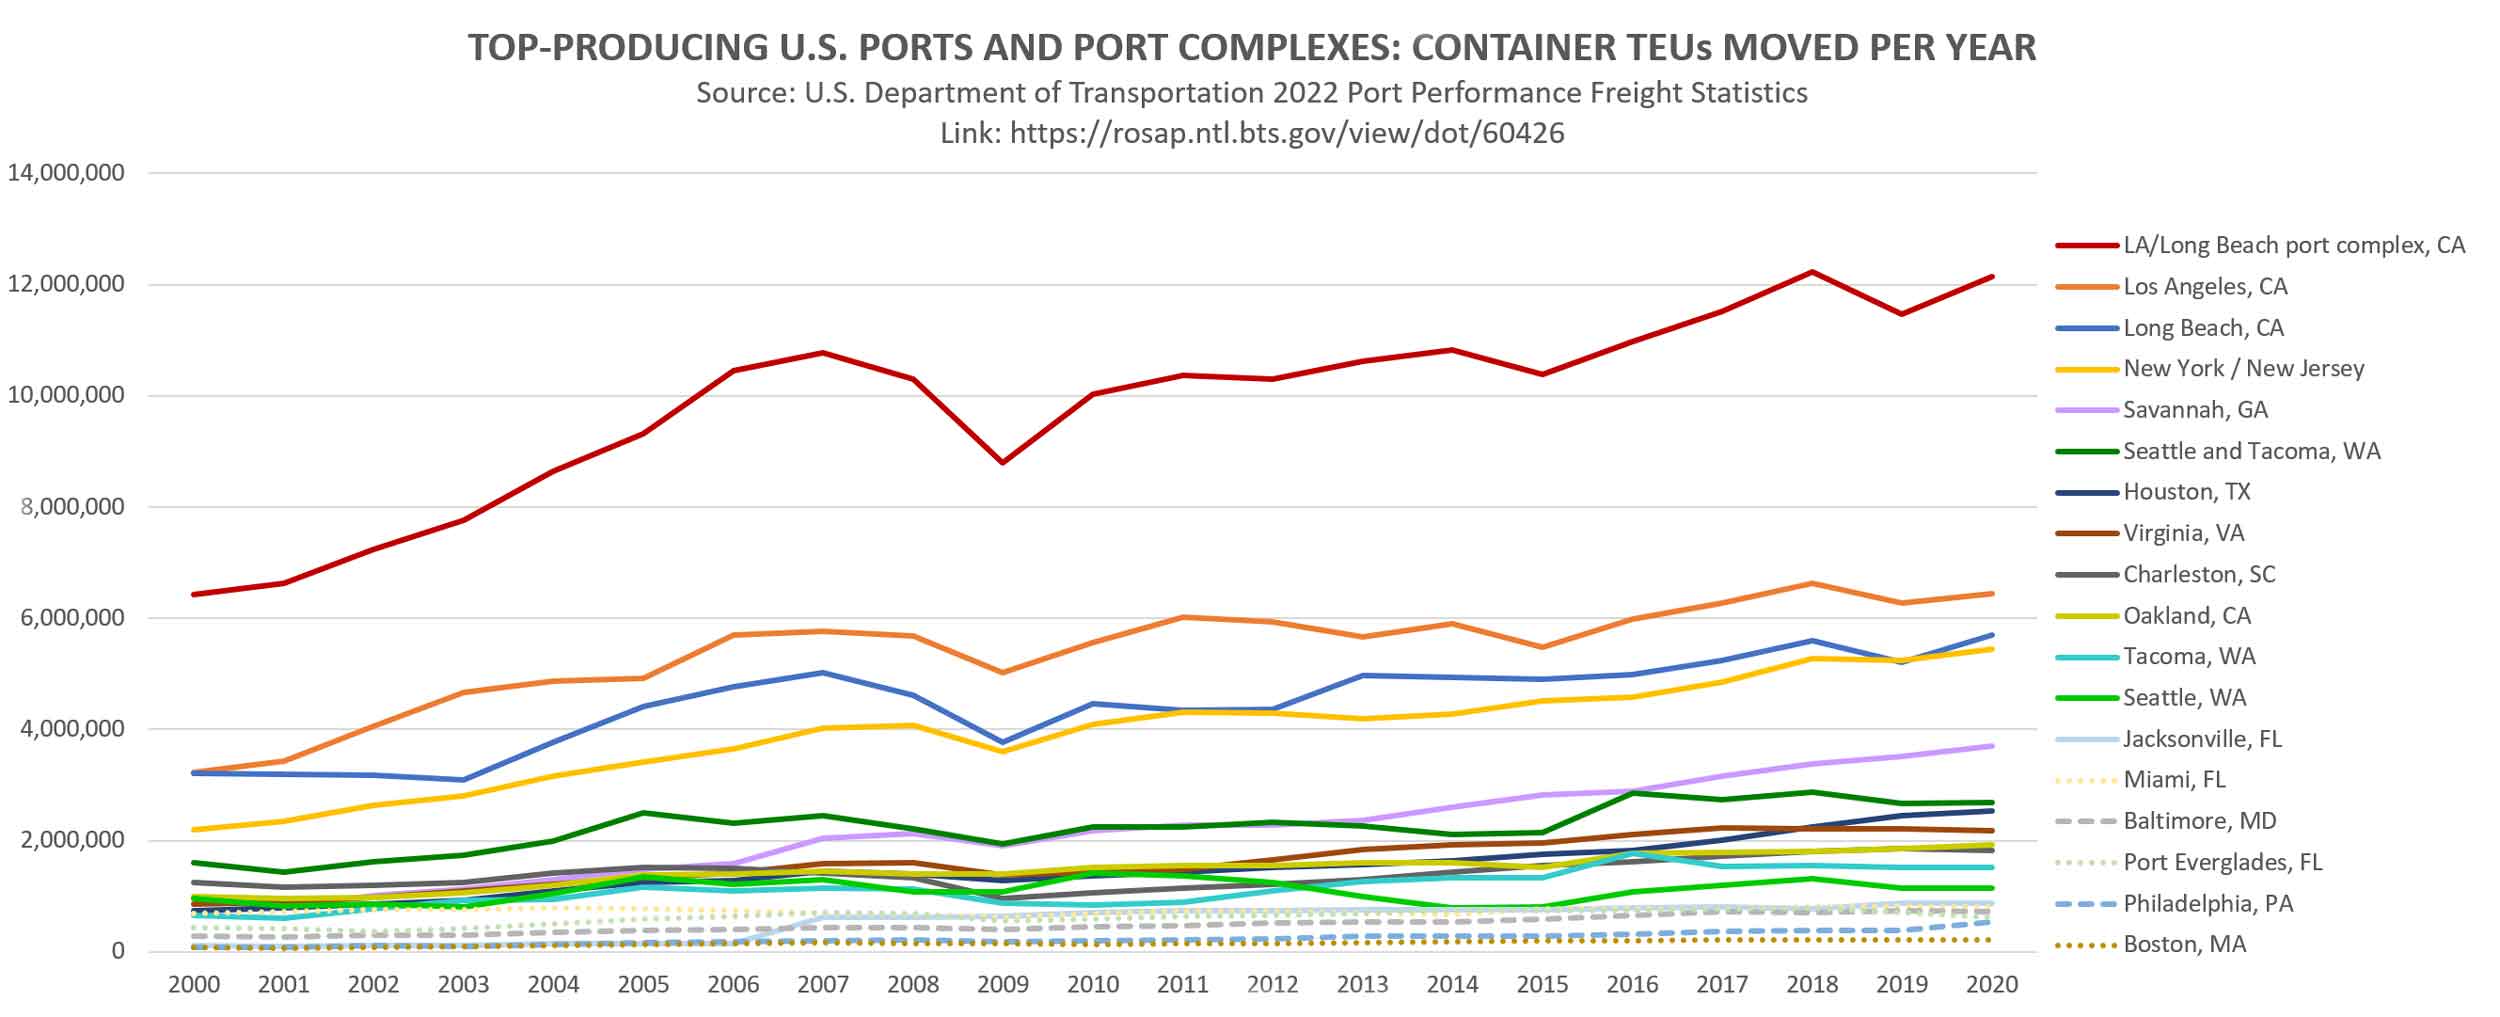
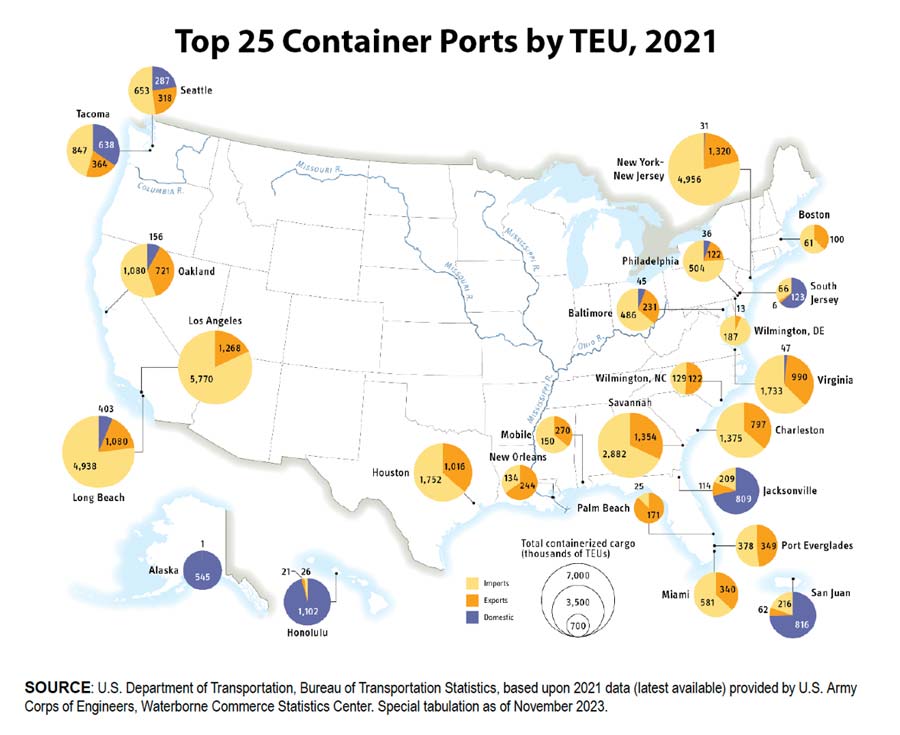
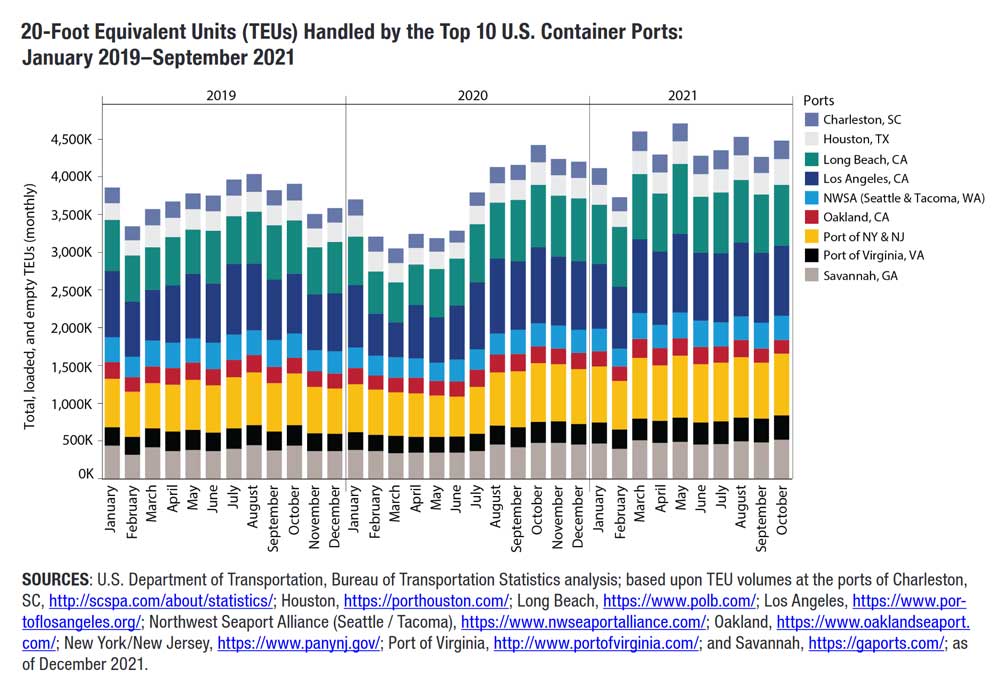
West Coast ports dominate the nation’s container trade, with the shortest transit times to Asian ports, as well as rail access to the Midwest and East Coast.
Source: USDOT 2024 Port Performance Freight Statistics Program: Annual Report to Congress, January 2024
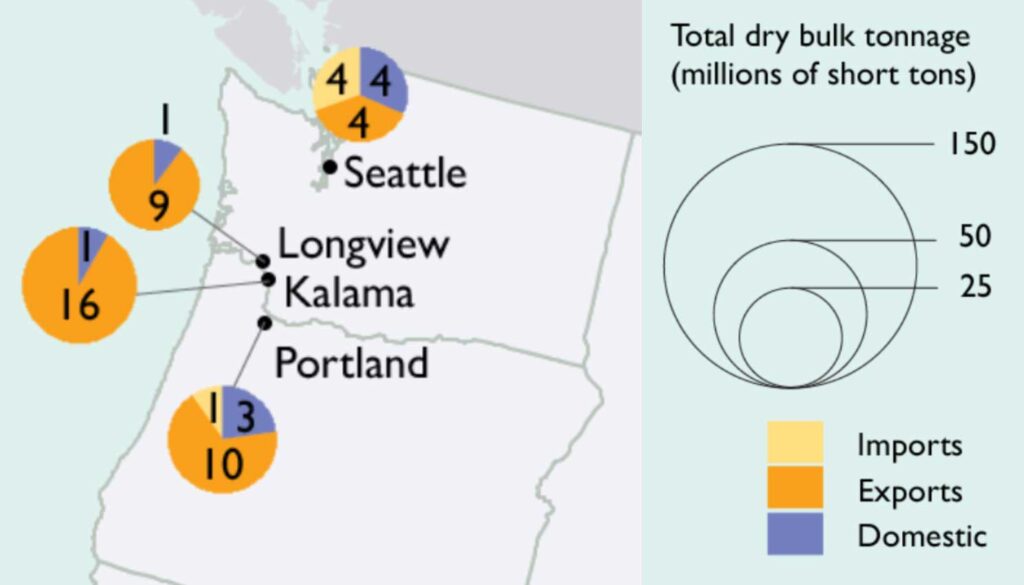
ILWU workers at Pacific Northwest ports on the Columbia River and Puget Sound move massive amounts of the country’s grain and other USA exports.
Source: USDOT 2022 Port Performance Freight Statistics Program: Supply-Chain Feature, January 2022
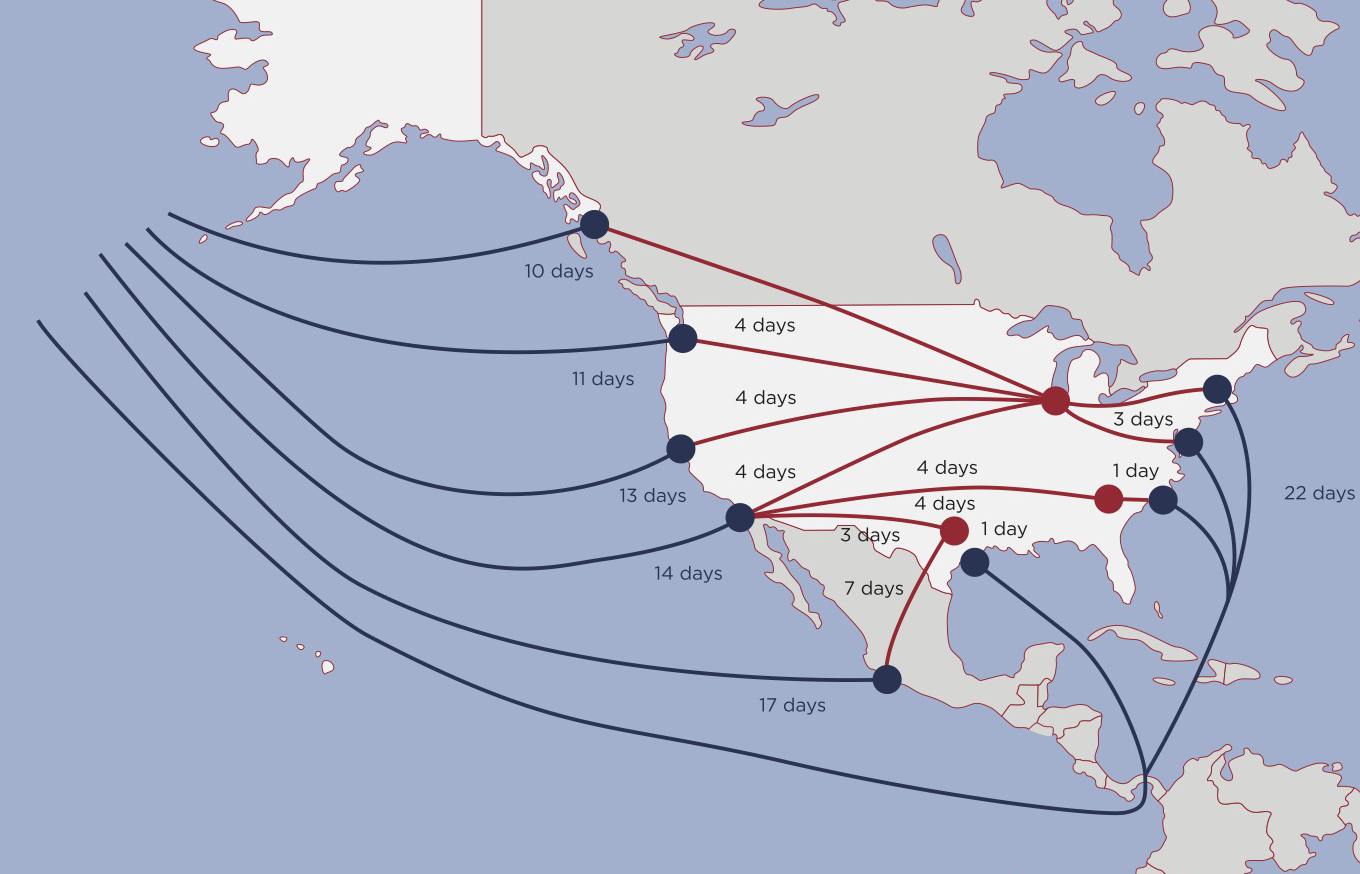
Shortest Trans-Pacific Trade Times
West Coast ports will always be the closet U.S. gateways to Asian ports, and remain among the fastest routes to the Midwest and East Coast as well.
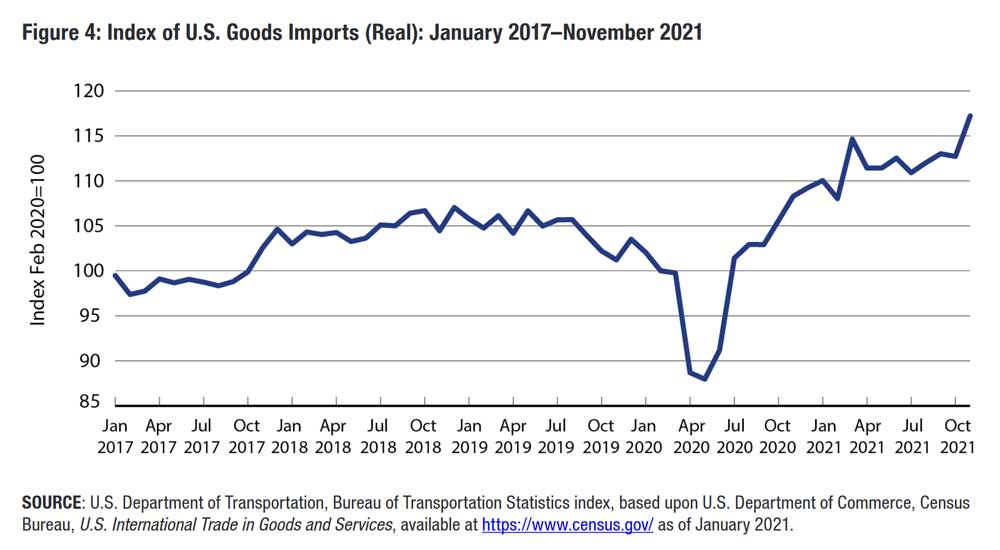
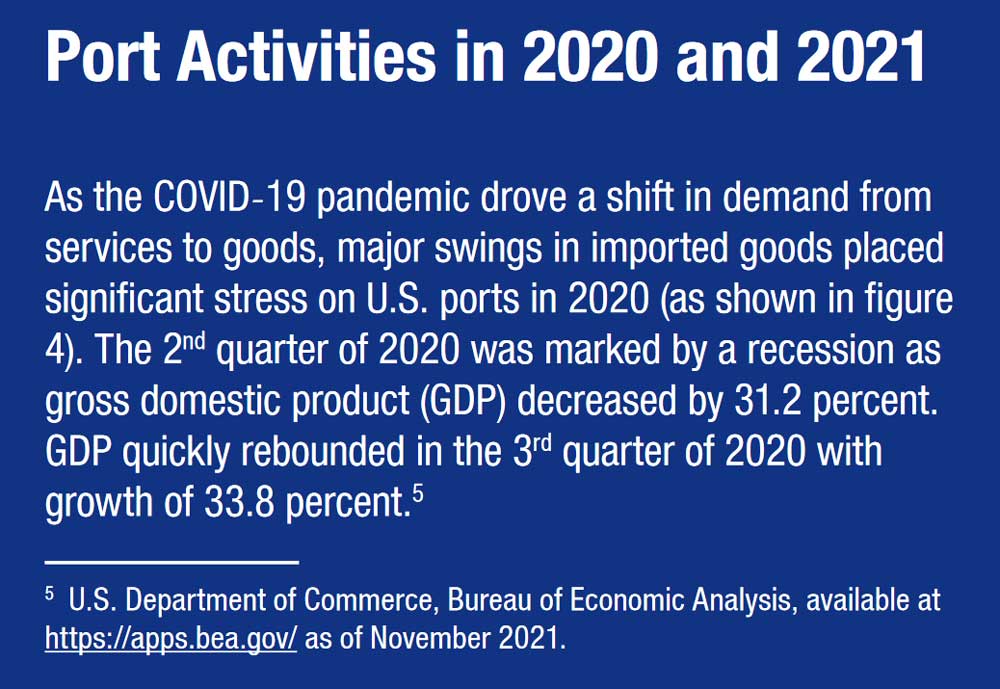
Source: USDOT 2022 Port Performance Freight Statistics Program: Supply-Chain Feature, January 2022
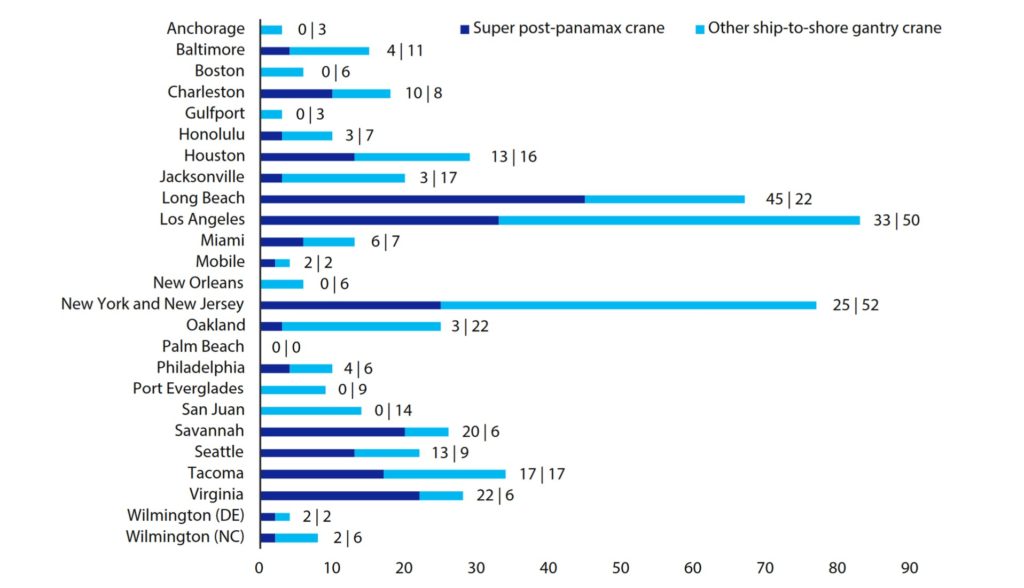
LA/LB Top Ship-to-Shore Gantry Cranes
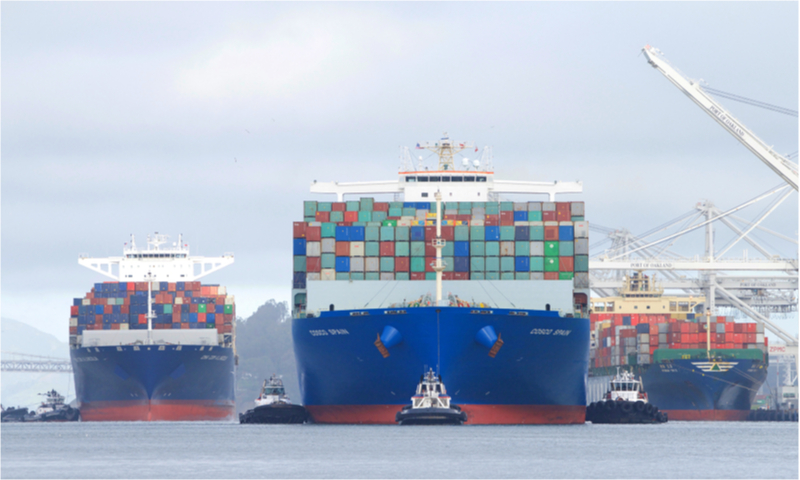
The U.S. West Coast tops container crane capacity, with the Los Angeles and Long Beach port complex offering 78 Super Post-Panamax cranes and 72 other ship-to-shore gantry cranes in 2018, according to the Bureau of Transportation Statistics.
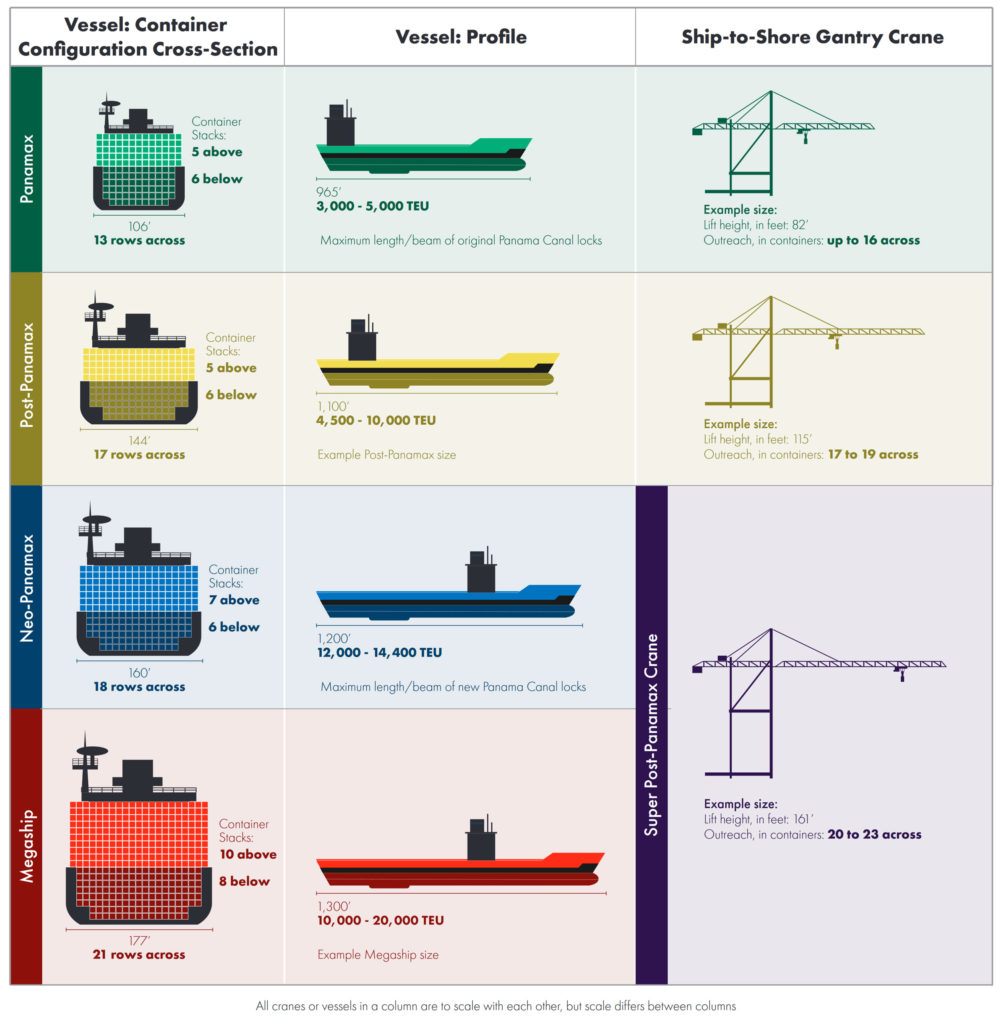
Larger cranes are needed to handle the newer generations of ships:
U.S. West Coast Ports
Southern California
Los Angeles
Long Beach
Port Hueneme
San Diego
Northern California
Oakland
Stockton
San Francisco
West Sacramento
Redwood City
Richmond
Eureka
Benicia
Crockett
Port Chicago
Oregon Area/Columbia River
Portland
Vancouver USA
Longview
Kalama
Rainier
Newport
Coos Bay/North Bend
Astoria
St. Helens/Columbia County
Washington Area/Puget Sound
Tacoma
Seattle
Olympia
Everett
Bellingham
Port Angeles
Aberdeen/Grays Harbor
Port Gamble
Anacortes
